Tracing for Local Development
Configuring tracing is much the same as any other service. A configuration file can be found in fxa-shared/tracing/config.ts. From there adjusting defaults can be done via environment variables.
Configuring Local Development
Setting the following environment variables which can easily be done by adding them to a .env file in FxA root, and then starting FxA by running dotenv -- yarn start.
- If you don’t already have dotenv installed, install it.
- Next add these settings to a the .env file in fxa root:
     TRACING_SAMPLE_RATE=1
     TRACING_BATCH_PROCESSING=false
     TRACING_OTEL_EXPORTER_ENABLED=true
     TRACING_OTEL_COLLECTOR_ENABLED=true
TRACING_OTEL_COLLECTOR_JAEGER_ENABLED=true - Now stop the dev stack with
yarn stop. - Now start the dev stack with
dotenv —- yarn start. - Once the dev stack has started. Run
pm2 status. Both the otel-collector and the Jaeger service should be in an ‘online’ status.
Some sanity checks to ensure that tracing is working
- Jaeger and otel-collector pm2 service will be online
- Applications will log a
trace initializedmessage - Traces will start showing up in Jaeger UI
- You should also see logs in the otel collector. They should indicate a connection to jaeger was setup.
- If you start using the application, you should also see requests going to http://localhost:4318/v1/traces coming from the client side.
Viewing Traces in Jeager
Once you are capturing traces, the next thing to do is explore them. Locally, we use Jaeger, which has a UI component that is fairly intuitive. Here's a quick use case that should get you going.
-
Follow the configuration steps above. Then go to http://localhost:3030 and go through a sign up flow.
-
Select fxa-content-client from the services drop down. Then click
Find Traces. -
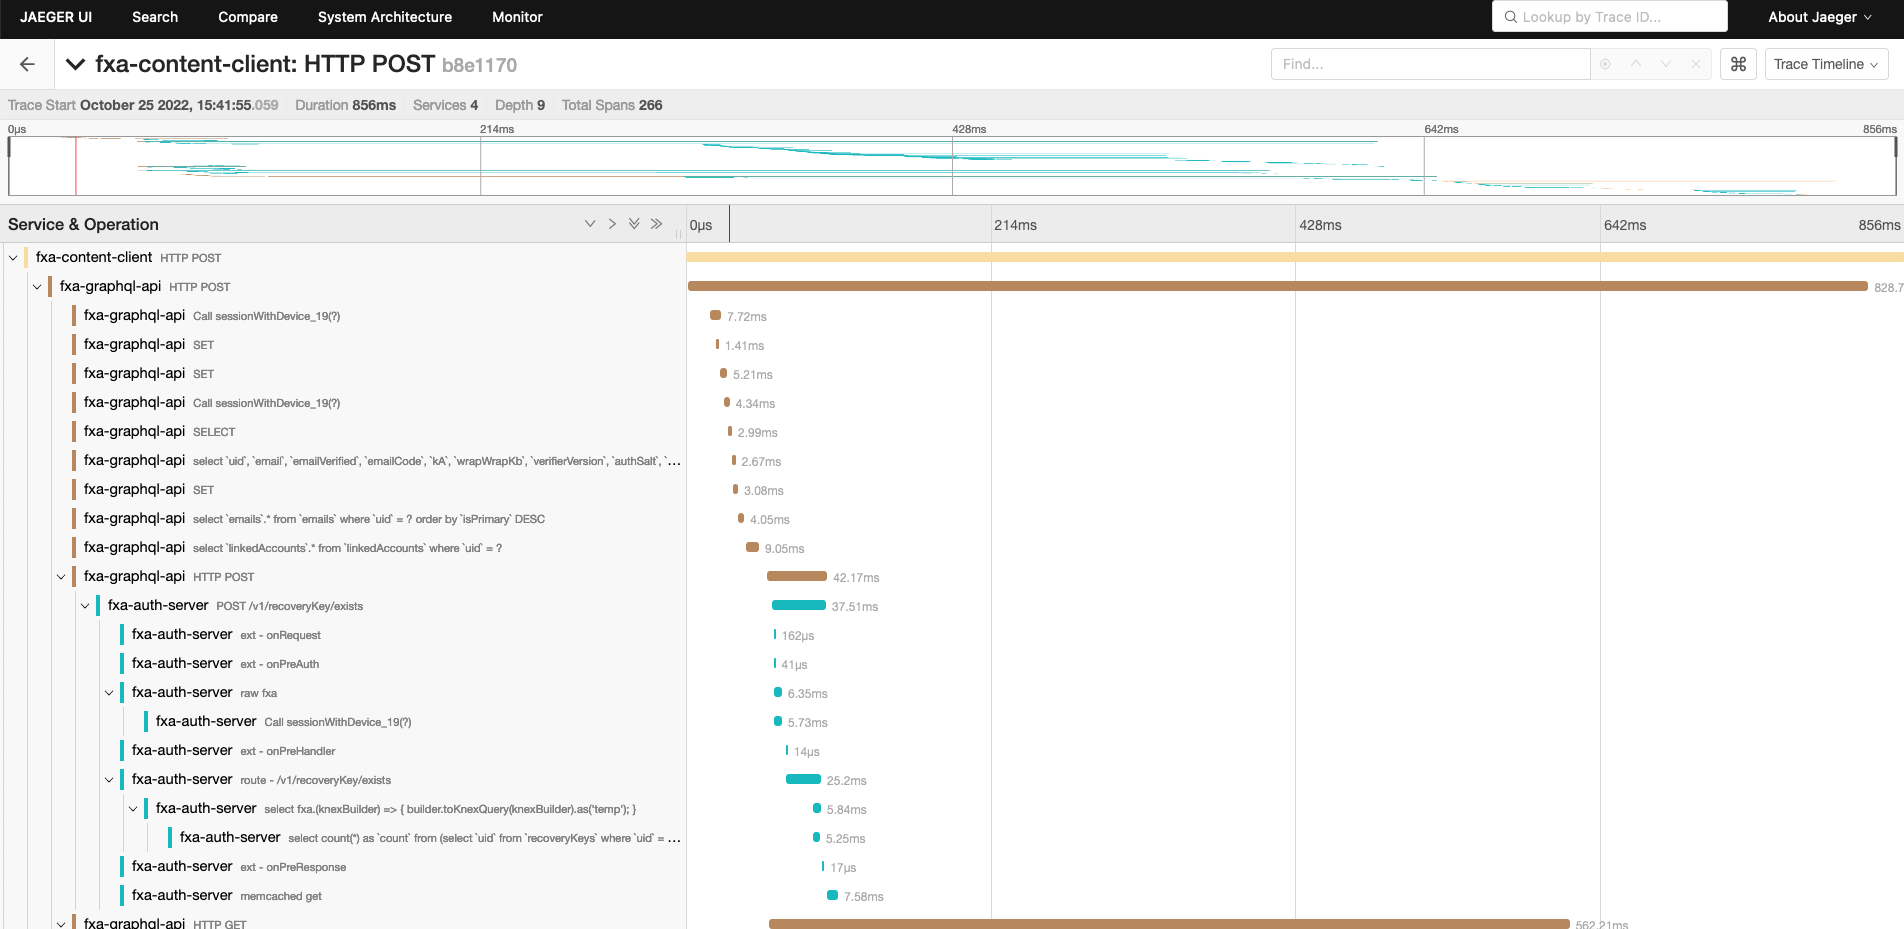
Select the trace with the longest elapsed time .This should be a post to graphql.

-
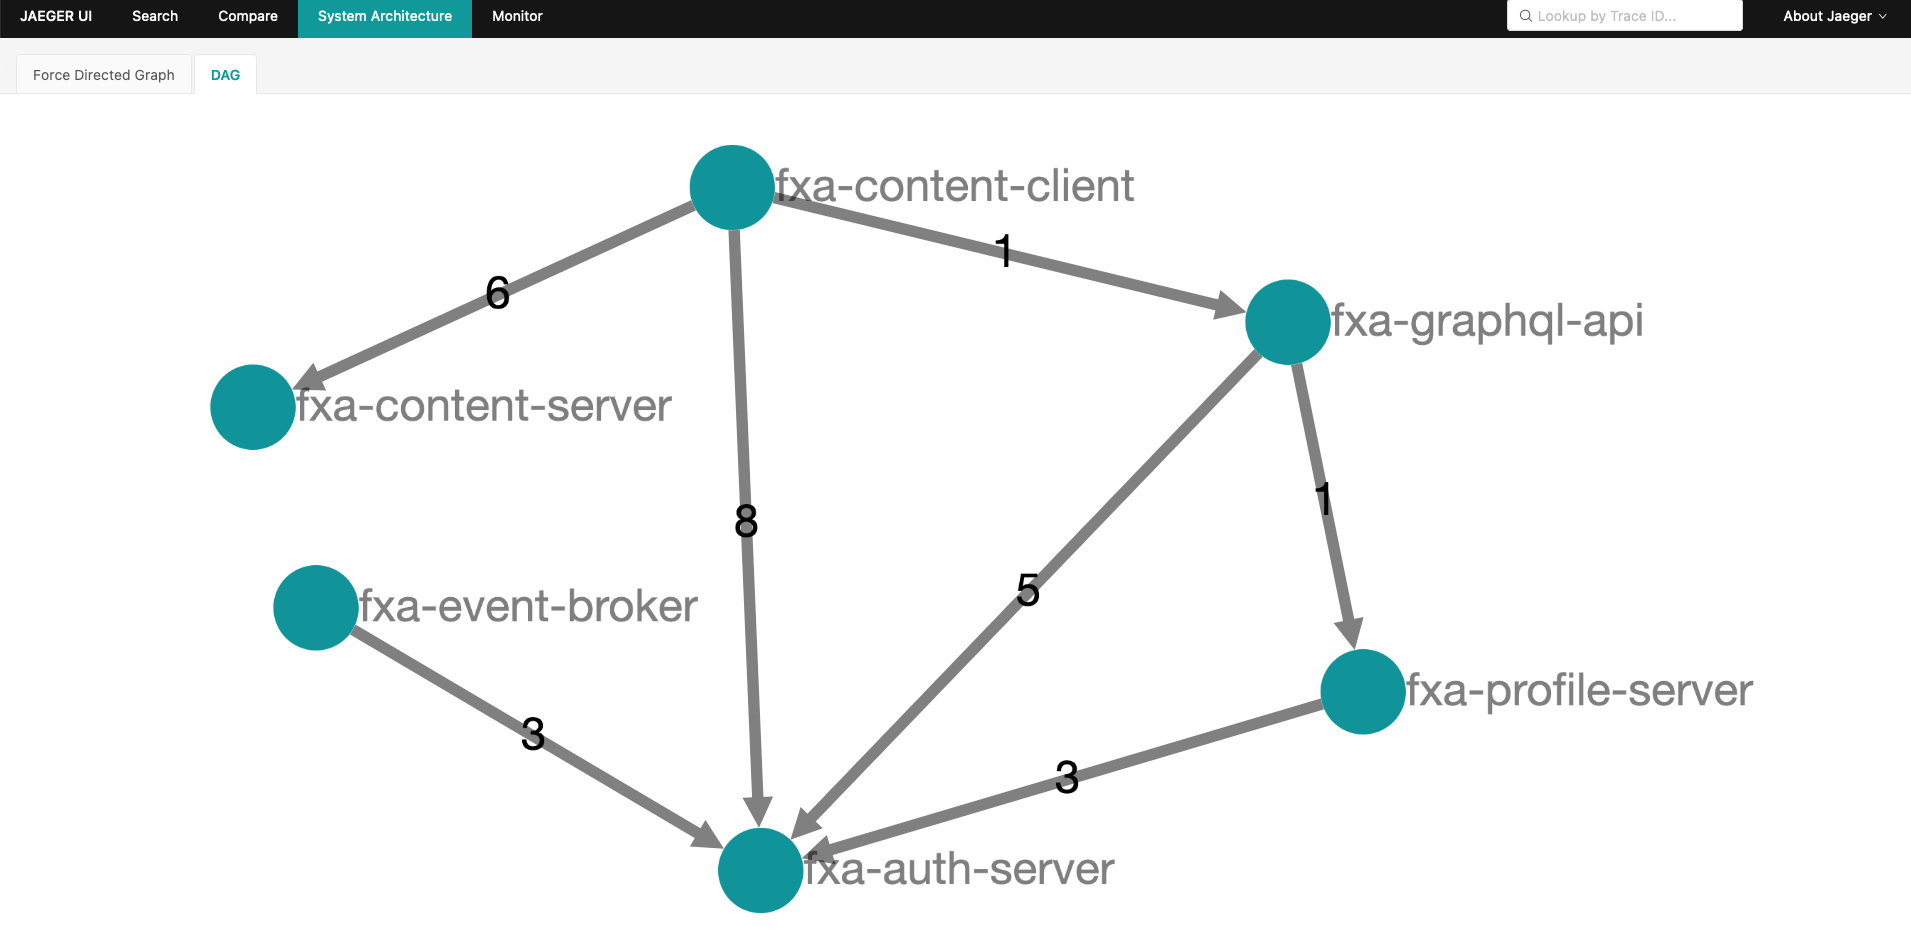
Note that we are seeing traces across multiple services. Fxa-content-client calls graphql which calls auth server and profile server, which also calls auth server.

-
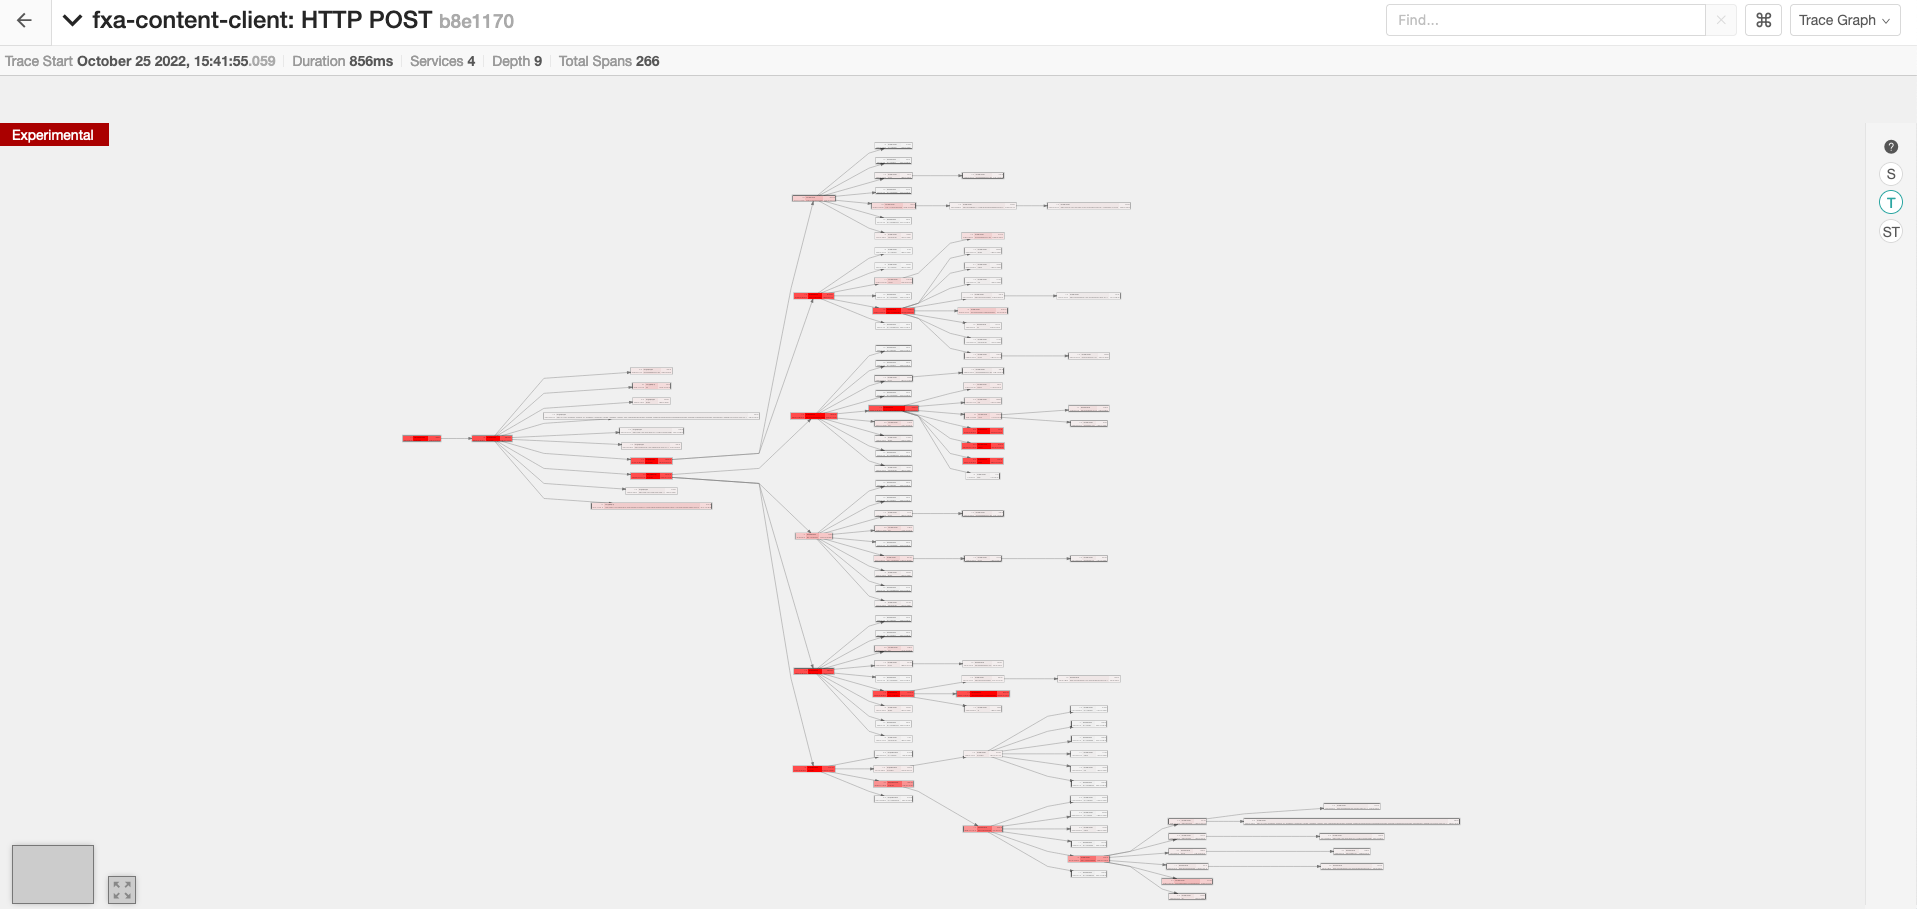
In the upper right switch the view to the ‘trace graph’ view. This will render a graphical view of the calls. Long running spans will be highlighted if you select the (T) option on the left hand toolbar.

-
Finally, in the main toolbar go to ‘System Architecture’. This will give a view of how the various services relate to one another.
