Metrics
Last updated: Oct 2025
Mozilla accounts collects metrics from servers running our code and clients accessing our services. Mozilla takes data collection seriously so our policies and processes around it may seem more complex than most organizations but it is in an effort to grant agency to users over their own data.
Note that the Mozilla Data Collection policies apply to Mozilla accounts.
Our code is deployed to a staging environment before it goes to production so the metrics detailed below are available for both environments. The details below will focus on production.
Keep in mind that Mozilla accounts allows users to opt-out of data collection via a toggle on the account settings page.
Application metrics
These are logs from Mozilla accounts code. These are probably the most useful logs for product decision making as they were written by hand by engineers. They are also the most complex.
- Example data recorded
- See the taxonomies in the Mozilla Data Docs.
- As we move to Glean the dictionaries here will remain up to date automatically: Frontend and Backend
- Recorded with
-
These are logged via mozlog as regular server logs.
-
The logs are immediately ingested into GCP Cloud Logging
-
From there they are passed and stored in BigQuery in the
moz-fx-fxa-prod.gke_fxa_prod_logdataset. -
Every 24 hours, some ETL jobs run which create derived tables from the original logs and store them in the
mozdataproject in BigQuery.mozdatais accessible by anyone at Mozilla. Please note: Derived tables do not include all the events or details in the original logs. You can read the queries that create the derived tables to see what is included. -
Additionally, there are some user-facing datasets of that same data, and also in
mozdata, which are designed to be easier to use.
-
- Accessible via
- BigQuery. Look for the
firefox_accountsdataset in themozdataproject. Be aware that there are large amounts of data in BigQuery and you can spend a lot of money if you don't restrict your queries. - Looker is backed by BigQuery and there is a Mozilla accounts folder there.
- Subscription Platform dashboards are located in the Subscription Platform folder. See also Subscription product metrics.
- There are several dashboards in grafana with a mix of these metrics on them
- See the section below about raw logs also
- BigQuery. Look for the
Submitting a Data Review request
Before new metrics can be collected with Glean, they must pass the Data Review process.
- Create a github issue with the data review request with the Data Review template
- Directly contact a member of the Data Review stewards, or request a review in the #data-stewardship-help channel.
- Create a PR containing the changes that will record the data. Do not merge the PR until the Data Review request has been approved.
Working with Raw Logs
If you need real-time data you need to be looking at the raw logs in moz-fx-fxa-prod.gke_fxa_prod_log or moz-fx-fxa-nonprod.gke_fxa_stage_log. Otherwise there will be a 24 hour delay.
Crashes
- Example data recorded:
t is undefinedand a link to the JS that failed to runAn internal validation check failed.and details about what the software expected to see and what it actually saw
- Recorded with
- Sentry
- Accessible via
- Sentry
- Look for any project starting with
fxa-. Eg.fxa-auth-prodandfxa-content-client-prod
Server Health
- Example data recorded
- There are 30 healthy pods running
- A pod is running at 100% cpu
- Recorded with
- The reporting tools built into the clouds we use
- Accessible via
- In their most detailed form, you'd need access to the cloud consoles themselves, but most of the data is also available in our Grafana instance. Here is one of our dashboards reporting system health
Front-end Performance
- Example data recorded
- It took 400ms to load
/settings
- It took 400ms to load
- Recorded with
- Accessible via
- Here is the content server
Subscription product metrics
These are a combination of application metrics and metrics more directly from subscription providers like Stripe, Apple and Google to answer product questions as initially specified by the PRD and Technical Specification for FXA-6556.
For high level information from the RP perspective, see Metrics for Relying Parties.
Looker
Looker is the business intelligence tool Mozilla uses to report on product metrics, and we have SubPlat dashboards there based on Logical Subscription(s) and All Event Counts explores created and maintained by our data engineering team.
Dashboards
Anyone at Mozilla can view the SubPlat Looker dashboards, which are in the Subscription Platform folder and include:
To obtain edit access, ask SubPlat's engineering manager to request it in the #data-help Slack channel.
Grafana dashboards have been moved to Yardstick
To obtain edit access for Yardstick dashboards, see the instructions on the Prometheus and Grafana Confluence page
Subscription Platform > Logical Subscription(s) explores
There are currently four Logical Subscription(s) explores:
- Daily Active Logical Subscriptions
- Represents all the subscriptions that were active at any point on a certain date.
- Monthly Active Logical Subscriptions
- Represents all the subscriptions that were active at any point during a certain month.
- Logical Subscription Events
- Represents changes we see to a subscription over time, i.e. lifecycle events such as start, end, cancel or plan change.
- Logical Subscriptions
- Represents the current state of subscriptions, including all subscriptions that have ended.
Data sources for these explores are described in Metrics for Relying Parties.
More information can be found in the SubPlat consolidated reporting ETL design document and from these walkthrough notes.
Logical subscriptions reflect one subscription per Stripe subscription item. So if a single Stripe subscription has two subscription items, this would be two separate logical subscriptions in these explores. This is in anticipation of potential support in the future for consolidated billing where each subscription item is effectively a separate subscription billed with a single invoice.
Mozilla accounts > All Event Counts explores
These data are events pulled out of FxA application logs (see Application metrics). There is currently one explore that we use for the SubPlat dashboard: All Event Counts.
How to inspect the underlying data from an explore or look
As explained in Application metrics, the data for these explores comes from ETL jobs where data exists in various tables in BigQuery. Here's how you can find out more information about a particular dimension in a Looker Look or Explore.
- Find the Look or Explore you want to inspect in Looker. For a Look in a dashboard, click "Explore from here" from the Look's overflow menu. E.g. navigate to the Monthly Active Logical Subscriptions explore.
- In the Explore view in Looker, in the left sidebar, hover over the dimension of interest (e.g. Monthly Active Logical Subscriptions > Subscription > Auto Renew) and click the Info icon, then click "Go to LookML".
- You'll be brought to a new page displaying the
viewfile. Here you can inspect which table the data came from in themozdataGCP project. Often this can be found by searching forsql_table_name. E.g.mozdata.subscription_platform.monthly_active_logical_subscriptions. - Now you have one of two choices, though the easiest is likely to search the data catalog (Acryl) for this dataset by name. The dot notation indicates the namespaces you'll find the table under, with the last value being the table name (e.g.
monthly_active_logical_subscriptions).- Search for the table name in Acryl.
- Select the Datasets > BigQuery >
mozdata>subscription_platformresult.mozdatais a GCP project in BigQuery with metrics for lots of Mozilla products and services.
- Select the Datasets > BigQuery >
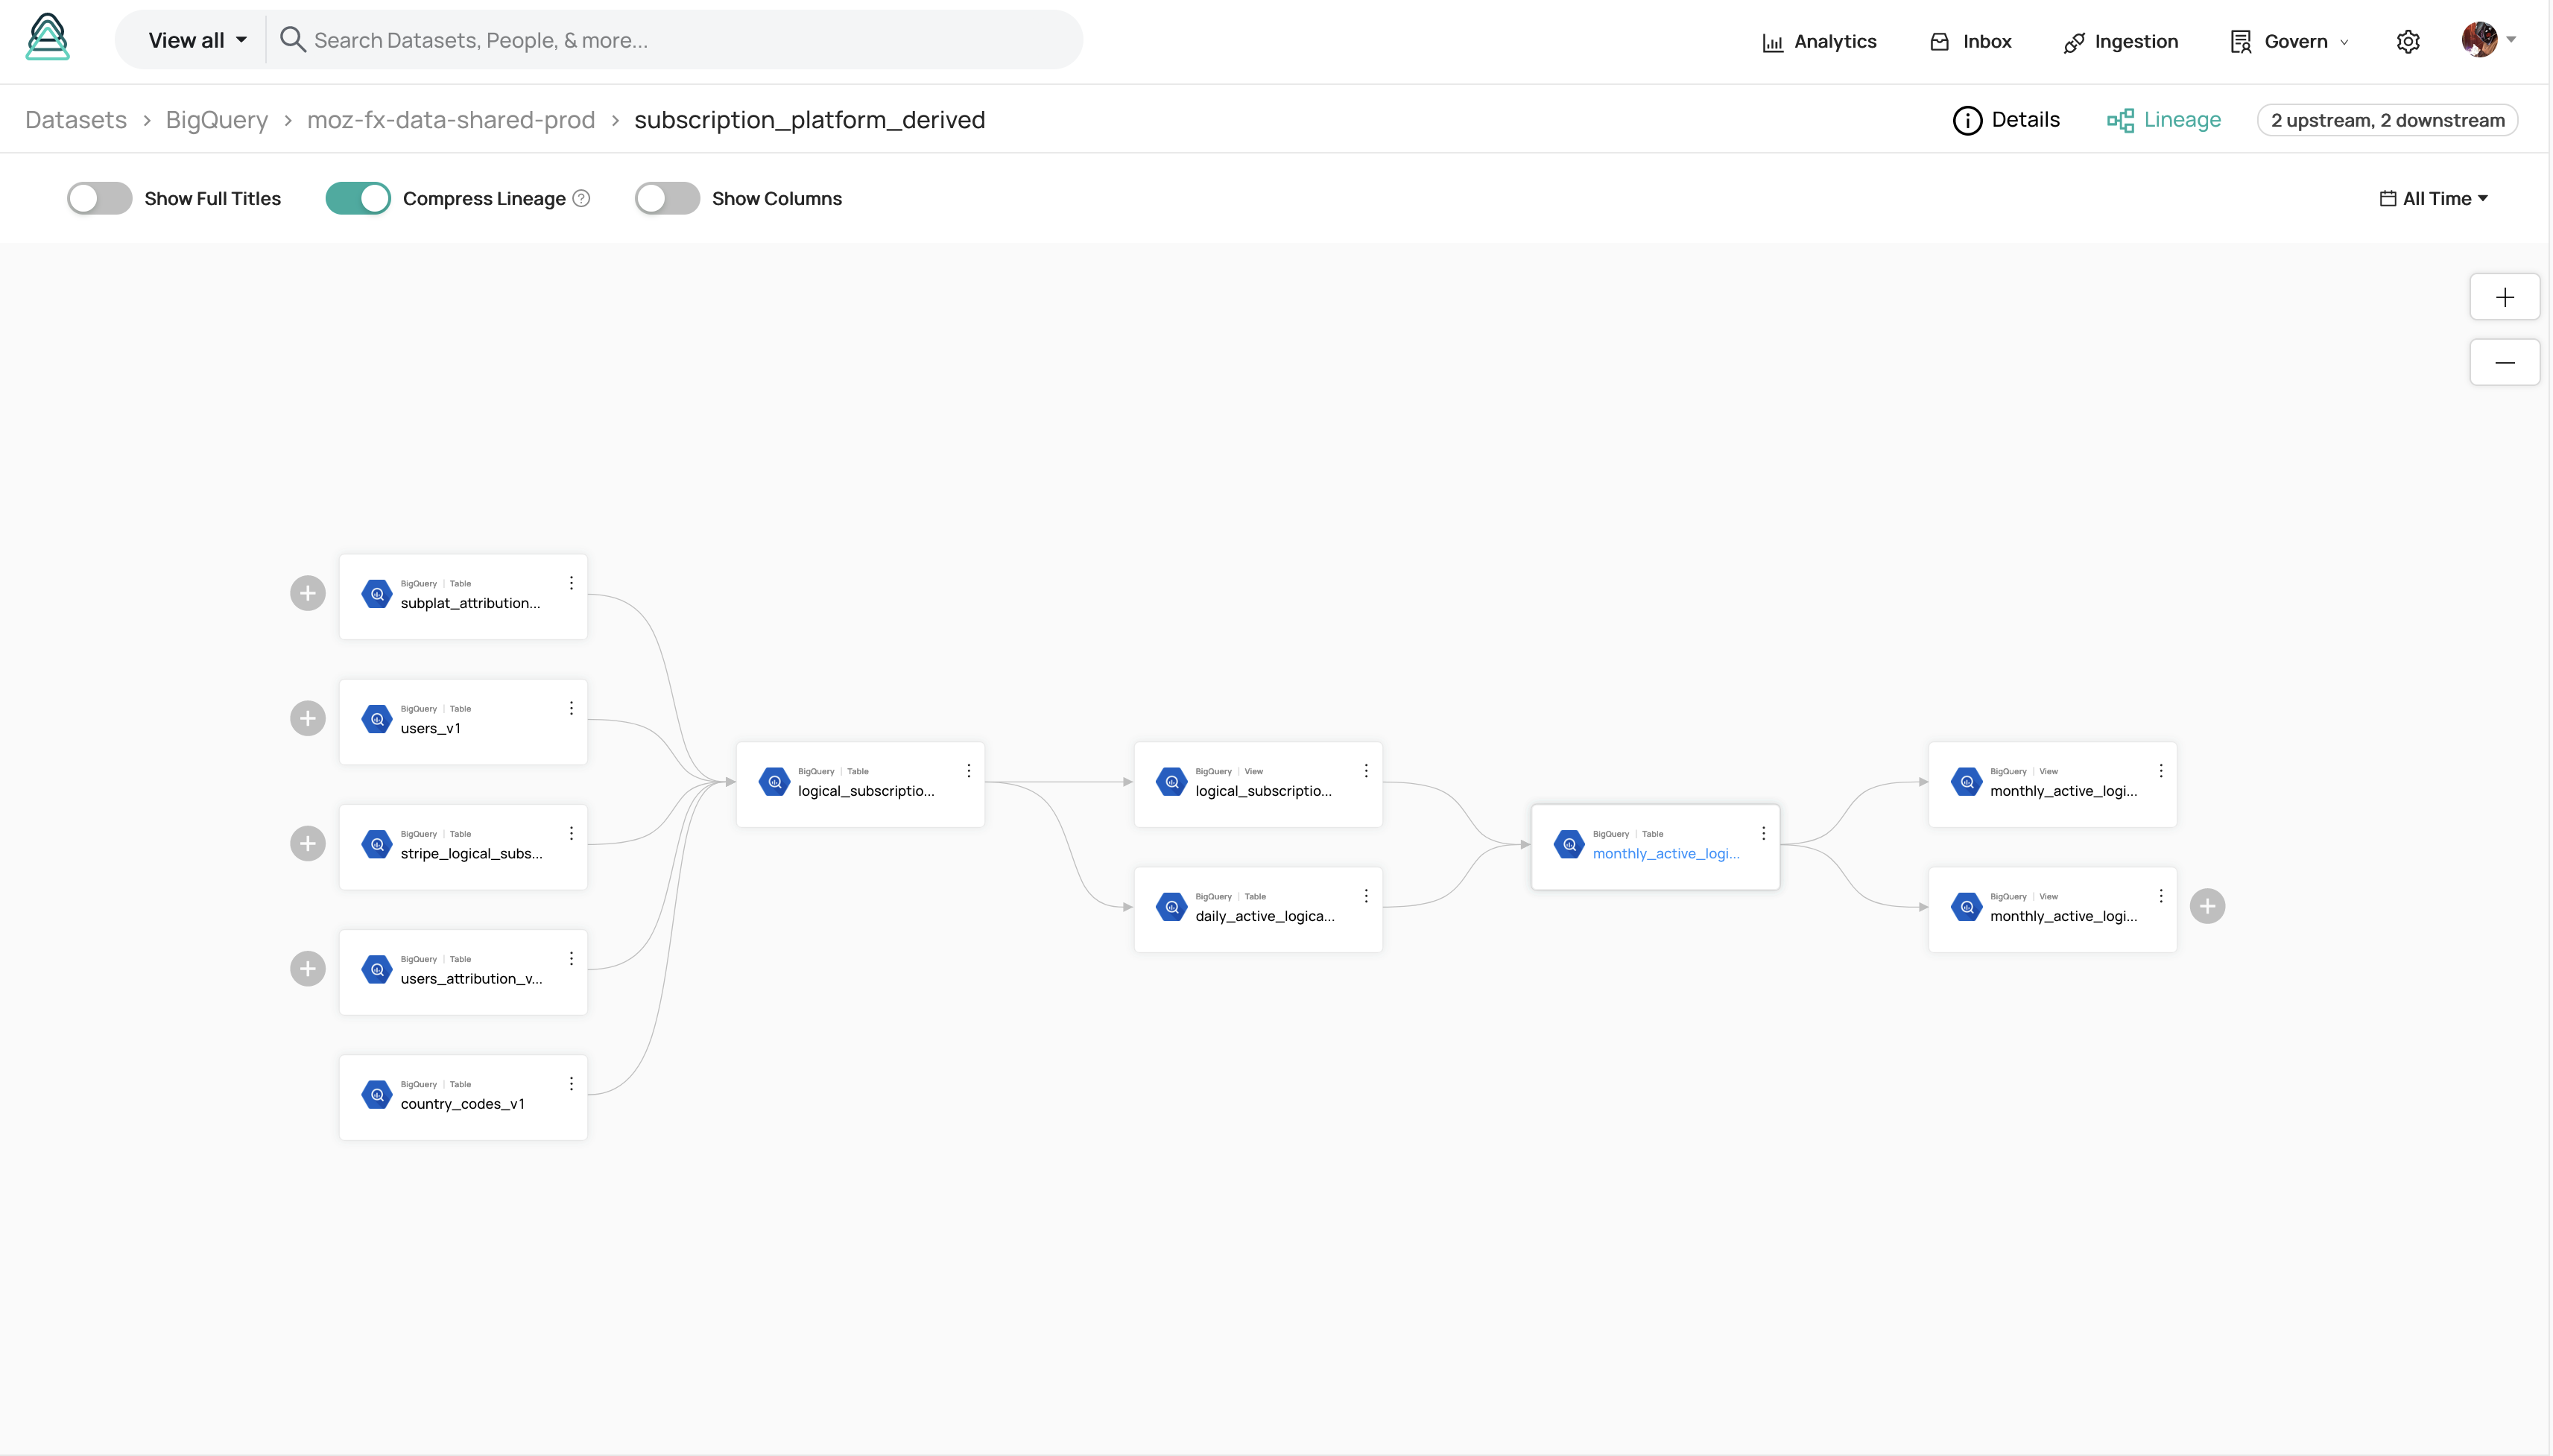
- Click the "Lineage" tab
- Click "Visualize Lineage"
- Continue to click the
+icons to the left of the table in question to find upstream tables, until you reach the origin table.
- Search for the table name in Acryl.
- As we can see from the diagram below, we may find how this dimension is set from the
stripe_logical_subscriptions_history_v1table. Looking that table up in thebigquery-etlrepo, we can confirm this.
The other option is to search for the queries (i.e. query.sql files) that create these tables in the bigquery-etl repo with a series of reverse look-ups.
- Search for the table name (e.g.
monthly_active_logical_subscriptions) moz-fx-data-shared-prod.subscription_platform.monthly_active_logical_subscriptionspulls from:moz-fx-data-shared-prod.subscription_platform_derived.monthly_active_logical_subscriptions_v1pulls from:moz-fx-data-shared-prod.subscription_platform_derived.daily_active_logical_subscriptions_v1pulls from:moz-fx-data-shared-prod.subscription_platform_derived.logical_subscriptions_history_v1pulls from:moz-fx-data-shared-prod.subscription_platform_derived.stripe_logical_subscriptions_history_v1pulls from:- Finally! We've found how this dimension is set from the table in the previous step.
A given query can pull from multiple tables, so the lineage for a given table is not necessarily linear and more likely branches. See example lineage from the data catalog image above.